ROAD SAFETY
Road-related incidents are one of the leading causes of unintentional injury death across all ages in BC.1

Each year, over 270 people are killed on public roads in BC.2
OVERVIEW
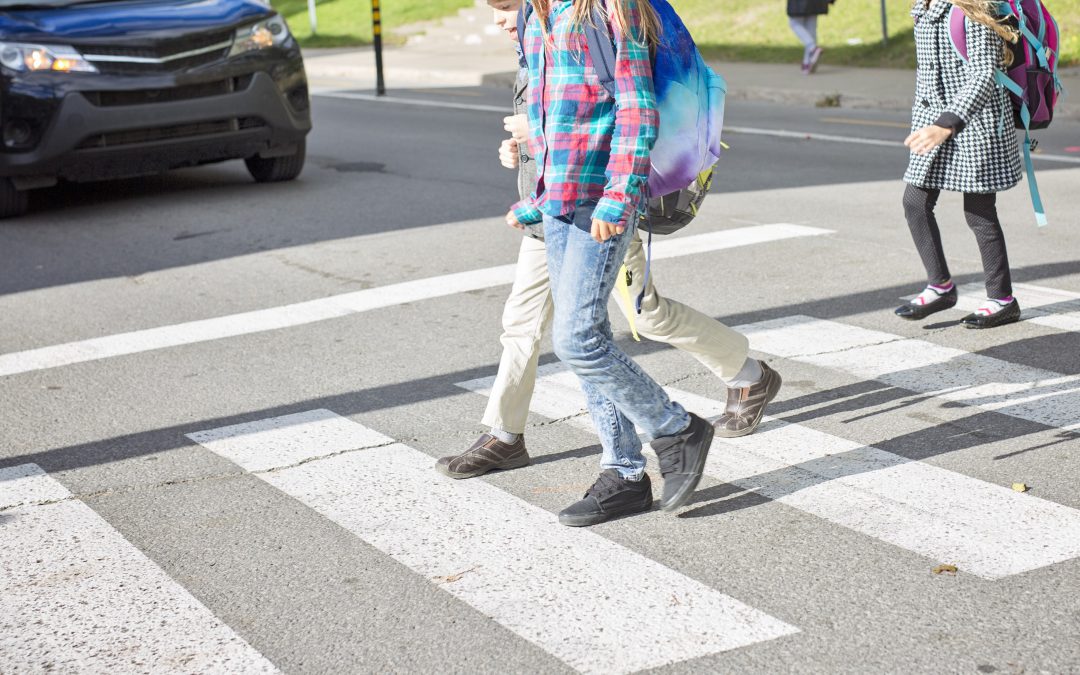
Each day, over 760 traffic crashes happen in BC, with about 150 being serious or fatal accidents.3 Most of the injuries resulting from collisions involve vehicle drivers and passengers; however, injury also occurs among vulnerable road users—pedestrians, cyclists, and motorcyclists.
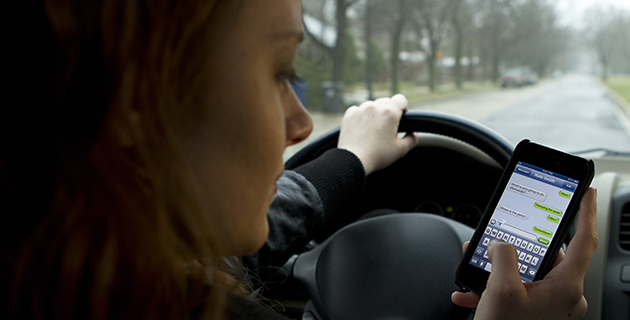
Speeding, distracted driving (e.g., phone use and texting), and impaired driving (using alcohol, drugs, or medications) are the leading contributing factors for motor vehicle collisions.
Transport incidents rank as the third highest injury costs in B.C. In 2023, the total cost of transport incidents in B.C. was $575 million. This includes $364 million in direct costs, like healthcare expenses, and $211 million in indirect costs, such as lost productivity.4
Men accounted for almost twice the injury costs from transport incidents compared to women, with the most significant cost differences between genders observed in the 25-64-year-old age group.4

Each year, more than 78,000 people are injured in motor vehicle crashes in BC.5
RESEARCH
BCIRPU supports road safety efforts at the policy, practice, and community levels. Road safety for all is one of the provincial priorities for injury prevention.
CHASE Study
The goal of Objective 3 of the CHASE study is to identify implementation strategies for built environment change at the municipal level to encourage safe, active transportation. Key informant interviews are being conducted in Vancouver and the surrounding area with those who have worked on projects involving optimizing the built environment—such as urban planners, researchers, school board representatives, and provincial transportation authorities—in order to identify the facilitators and barriers for implementing built environment change at the municipal level.6
RESOURCES
- Injury Insight: Motorcycle Injuries in British Columbia (PDF) (May 2020)
- Injury Insight: Young Drivers: A Population at Risk (PDF) (May 2019, updated from July 2016)
- Injury Insight: Pedestrian Injury from Motor Vehicle Crashes in BC (PDF) (May 2017)
- Injury Insight: Road Safety Among Vulnerable Road Users (PDF) (November 2014)
- Injury Insight: Cycling Injuries in Children (PDF) (June 2011)
DATA
- Police Traffic Accident System Data, available on our Injury Data Online Tool (iDOT)
News
59 communities receive funding for Vision Zero projects
Over $1 million in grants to go towards improving vulnerable road user safety across British Columbia, including in rural, remote, and Indigenous communities.

Dr. Ian Pike receives fellowship from Japanese research society
Dr. Pike will work on a child passenger safety campaign with researchers in Chiba.

New website outlines financial and human cost of injury in BC
costofinjury.ca uses interactive charts and graphs to illustrate the burden of injury in BC.
37 projects funded in this year’s Vision Zero Grant Program
Projects funded include improvements such as crosswalk infrastructure, closed streets, traffic calming, speed limit reduction pilots, and road safety planning.

First-ever Vision Zero Summit in BC
Over 100 road safety experts, municipal government staff, civic leaders, researchers, and public health professionals attended the first-ever Vision Zero summit in BC.

October 15-21 is Teen Driver Safety Week
Youth are over-represented in all road-related injuries and deaths.
Injury Insight: Young drivers, a population at risk
This Injury Insight investigates the circumstances around teen driver deaths in BC.
1.Provincial injury prevention priorities. (2017). BC Injury Prevention Committee. Available at: http://www.bccdc.ca/pop-public-health/Documents/bcipc-provincial-injury-prevention-priorities-2017.pdf
2. Business Information Warehouse – Traffic Accident System, Insurance Corporation of British Columbia. Data as of March 31st, 2023. Retrieved from Injury Data Online Tool (iDOT), BC Injury Research and Prevention Unit, 2023.
3. ICBC. Quick Statistics: Crashes and Casualty Crashes. 5-year average from 2018-2022. Available from: https://public.tableau.com/app/profile/icbc/viz/QuickStatistics-Crashandcasualtycrashes/CrashesCasualtyCrashes
4. Rajabali F, Zheng A, Turcotte K, Bruin S, Pike I. (2022). Cost of Injury in British Columbia 2022. BC Injury Research and Prevention Unit: Vancouver, BC. [Cost from 2018 converted to 2023 dollars using the Bank of Canada inflation calculator]
5. ICBC. Quick Statistics: Injured victims. 5-year average from 2018-2022. Available from: https://public.tableau.com/app/profile/icbc/viz/QuickStatistics-Injuredvictims/InjuredVictims
6. Hagel, B. E., Macpherson, A., Howard, A., Fuselli, P., Cloutier, M. S., Winters, M., … & Hubka, T. (2019). The built environment and active transportation safety in children and youth: a study protocol. BMC public health, 19(1), 1-13.
7. Canadian Council of Motor Transport Administrators. Canada’s Road Safety Strategy; 2025: Towards Zero: the Safest Roads in the World (2016). Available at: https://roadsafetystrategy.ca/web/road-safety-strategy/files/public/docs/RSS-2025-Report-January-2016-with%20cover.pdf
8. Government of BC. (2016). PHO’s Annual Report: Where the Rubber Meets the Road: Reducing the Impact of Motor Vehicle Crashes on Health and Well-Being in BC. Available from: https://www2.gov.bc.ca/assets/gov/health/about-bc-s-health-care-system/office-of-the-provincial-health-officer/reports-publications/annual-reports/reducing-motor-vehicle-crashes-bc.pdf